Picture graphs
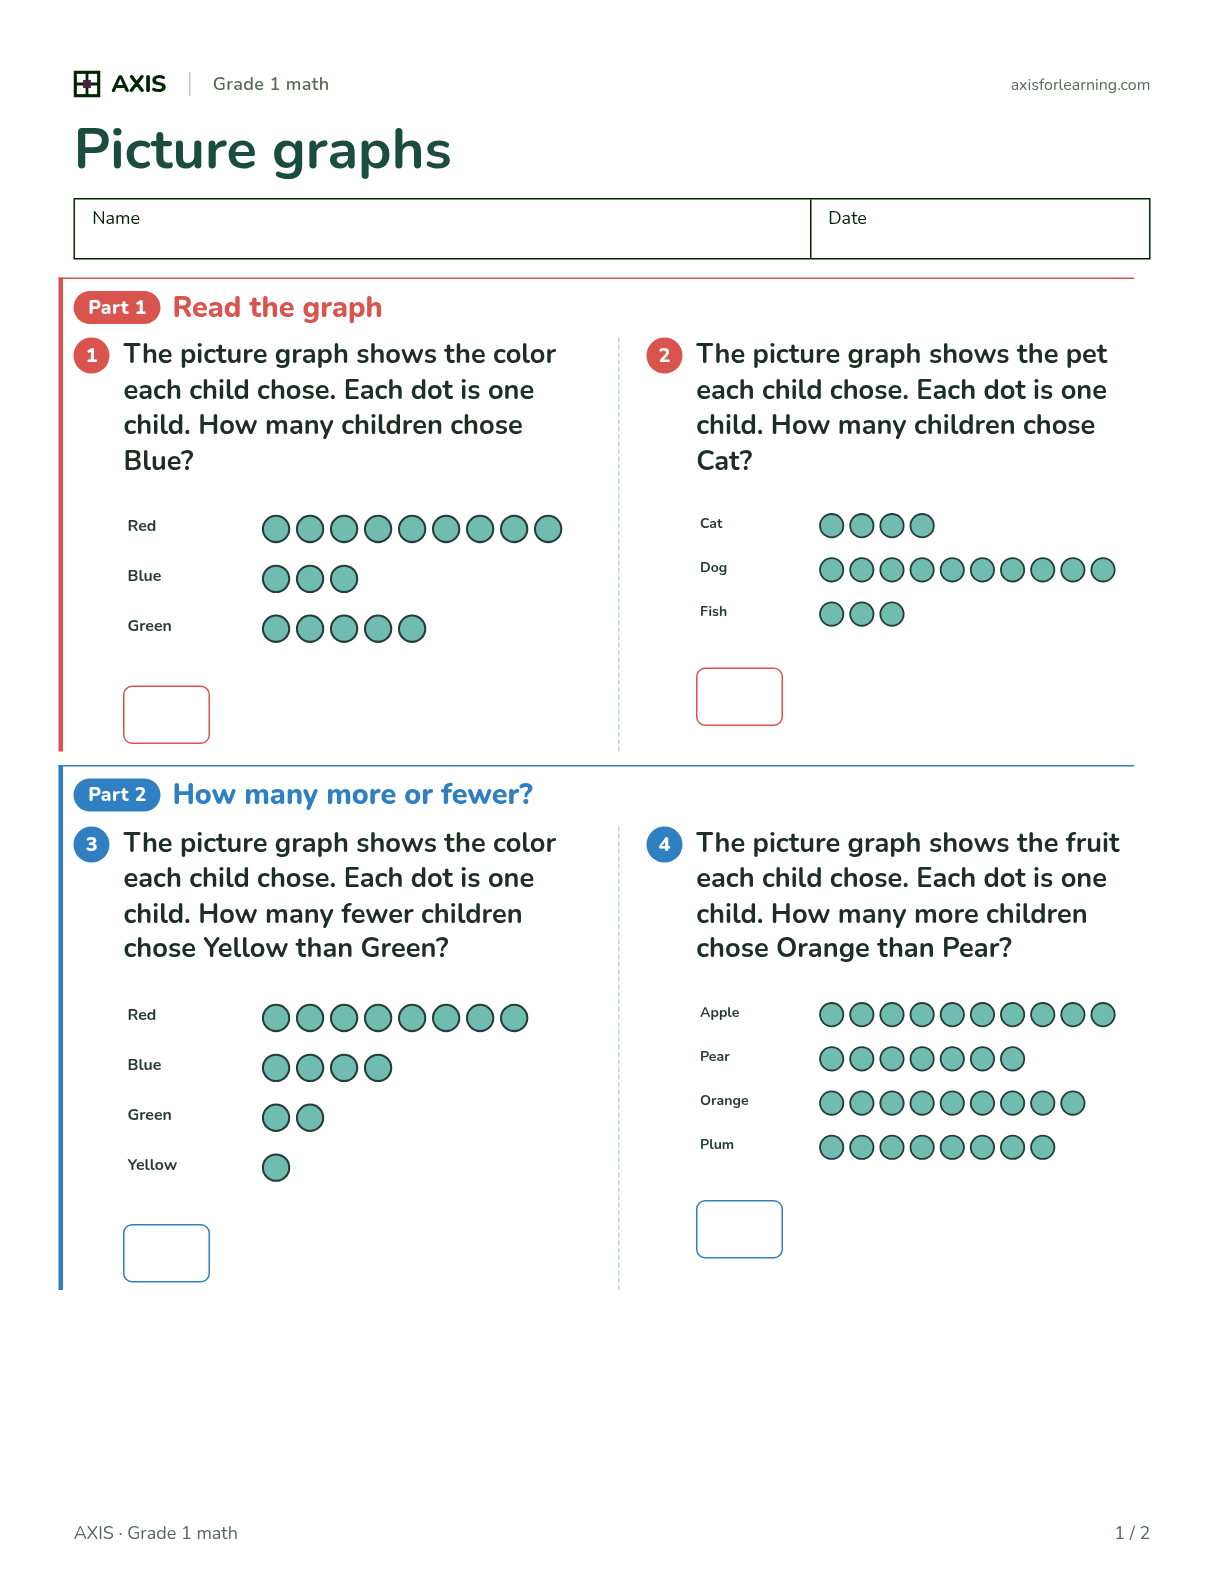
This Grade 1 worksheet practices reading and making picture graphs with up to three or four categories and answering how many more or fewer (Common Core 1.MD.C.4).
- Grade 1
- Measurement and data
- 2 pages + 1-page answer key
- Common Core aligned
- 6 free versions
Every PDF includes the answer key
8 questions on 2 pages, plus a 1-page answer key · each version has different numbers · Print from the browser
Need a different skill or more questions?
Make a new worksheet in seconds, with its answer key.
About this worksheet
A Grade 1 picture graph worksheet with 8 questions in four parts. Children read a picture graph where each dot is one child, find how many more or fewer chose one thing than another, find how many children there are in all, and make their own picture graph from a list of choices. The graphs have up to four categories with one dot for each child. Every version has new data and its own answer key.
What's inside this worksheet
- Part 1
Read the graph
Questions 1–2. A picture graph of the colors children chose. Children write how many chose one color.
- Part 2
How many more or fewer?
Questions 3–4. The same kind of graph. Children find how many more or fewer chose one color than another.
- Part 3
How many in all?
Questions 5–6. A picture graph of pets. Children add the rows to find how many children in all.
- Part 4
Make a picture graph
Questions 7–8. A list of how many children chose each pet. Children draw one circle for each child in its row.
Curriculum objectives covered
Common Core State Standards for Mathematics
- 1.MD.C.4Measurement and data
“Organize, represent, and interpret data with up to three categories; ask and answer questions about the total number of data points, how many in each category, and how many more or less are in one category than in another.”
On this sheet: Parts 1 to 3 interpret picture graphs: how many in one category, how many more or fewer in one than another, and the total. Part 4 represents data in a picture graph. Some graphs have four categories, one more than the standard names.
How teachers use it
- Line them up
- In Part 2, children can match the dots in two rows one to one and count the dots left over. That is how many more.
- Class graph
- Before Part 4, make a picture graph with sticky notes: each child puts one note in the row for their favorite fruit.
- Ask your own question
- After the sheet, each child writes one question a partner can answer from their Part 4 graph.
Questions teachers ask
- How many problems are on this worksheet?
- 8 questions in 4 parts on 2 pages, with a 1-page answer key at the end.
- What grade and standard is it for?
- Grade 1. Common Core: 1.MD.C.4.
- Can I print more than one version?
- Yes. There are 6 ready-made versions, each with different numbers and its own answer key, and the same version always prints the same. For more, generate a new worksheet in the generator.
- What is a picture graph?
- A graph where each picture or dot stands for one thing, set out in rows by category. In Grade 1 each picture is one, so children count them.
- Is this a bar graph worksheet?
- No. Bar graphs and graphs where one picture stands for several come in Grade 2.
Common Core State Standards © Copyright 2010. National Governors Association Center for Best Practices and Council of Chief State School Officers. All rights reserved.
Need a different skill?
Make your own worksheet for any K–8 skill in seconds, with its answer key.