Compare graph features
This Grade 2 worksheet practices compare graph features (Alberta Statistics 1).
A separately selected teacher-led activity. Read the materials, procedure and marking rule in the teacher key before teaching.
Every PDF includes the answer key
1 grid · answer key on the last page · each version has different numbers · Print from the browser
Need a different skill or more questions?
Make a new worksheet in seconds, with its answer key.
On this sheet
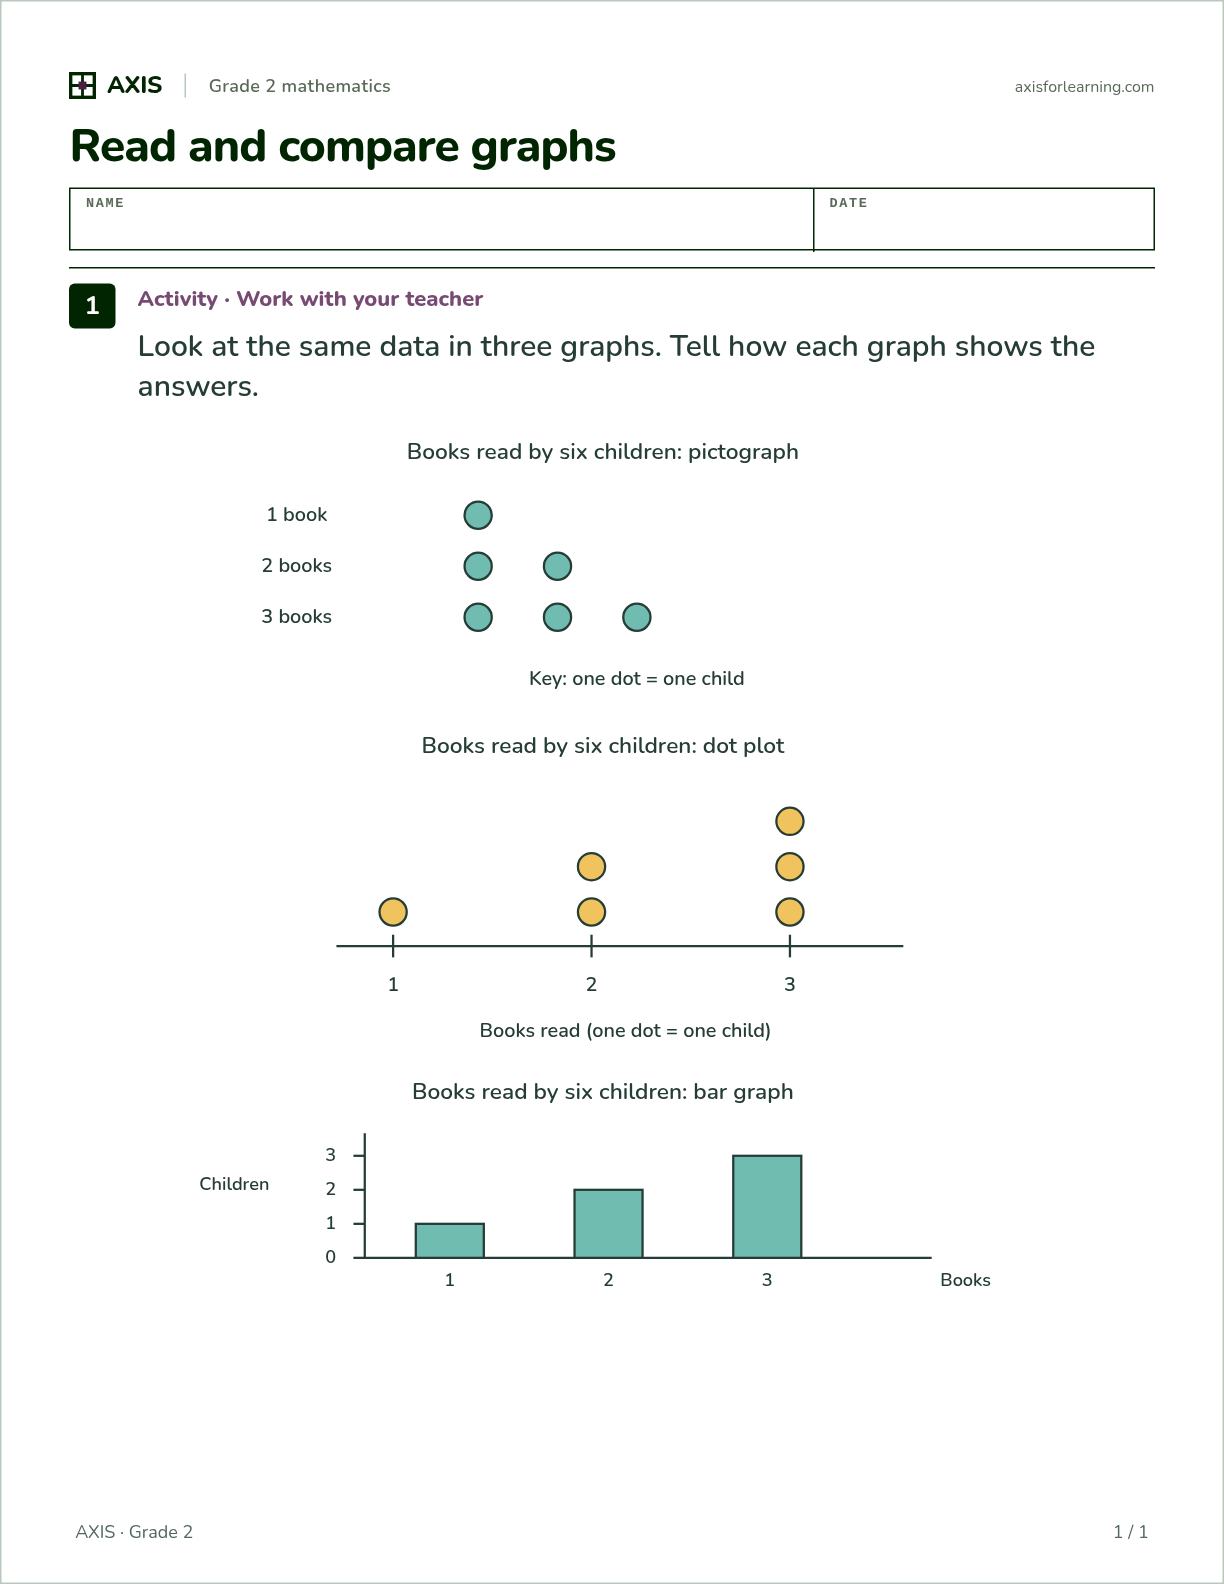
- Look at the same data in three graphs. Tell how each graph shows the answers. — answer: Relates the same observations/counts across all three representations, and accurately describes the requested features of each. Selecting a supplied statement does not independently supply the child’s explanation.
Questions teachers ask
- How many problems are on this worksheet?
- 1 on one page, with the answer key on the last page.
- What grade and standard is it for?
- Grade 2. Alberta: Statistics 1.
- Can I print more than one version?
- Yes. There are 6 ready-made versions, each with different numbers and its own answer key, and the same version always prints the same. For more, generate a new worksheet in the generator.
Need a different skill?
Make your own worksheet for any K–8 skill in seconds, with its answer key.